Fermentation is one of the most important stages of beer production. It is also one of the moments when having accurate, well-organized information can make the biggest difference.
Gravity tells you how fermentation is progressing, while temperature helps you understand the conditions in which the yeast is working. However, taking these measurements is only part of the process. Brewers also need a simple way to record them, compare them, and understand how the batch is developing over time.
That is where a clear fermentation tracking interface becomes valuable.
Why a Clear Fermentation Interface Matters
When you open a batch, you should be able to understand its current condition without searching through notebooks, spreadsheets, or multiple screens.
A well-designed brewing interface brings gravity readings, temperature readings, dates, and production stages together in one place.
This makes it easier to recognize changes and answer practical questions such as:
- Is the gravity dropping as expected?
- Has fermentation started to stabilize?
- Did the temperature remain within the desired range?
- Was there an unusual change during the process?
- Is the beer ready to move into conditioning?
Manual Fermentation Readings Are Still Valuable
You do not need IoT devices to track fermentation effectively.
Many small breweries and homebrewers already take reliable measurements using hydrometers, refractometers, thermometers, and other common brewing tools. Recording these results manually creates a useful history of the batch without requiring additional sensors or connected equipment.
Every manual gravity or temperature reading becomes part of the production record. Over time, this information can help you compare batches, identify recurring patterns, and improve consistency.
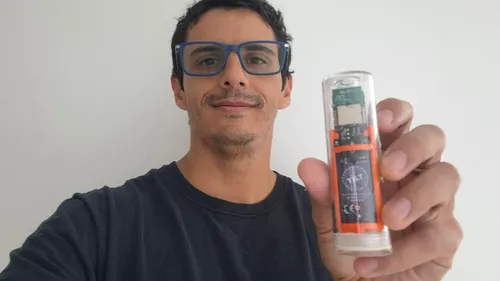
IoT sensors can provide automated and more frequent data, but they should be an option rather than a requirement. Brewers should be able to start with the instruments they already use and adopt connected technology when it makes sense for their operation.
Visualize Your Fermentation Curve
A list of readings is useful, but a fermentation chart makes the entire process easier to understand.
By displaying gravity and temperature over time, a fermentation curve allows you to see how the batch is progressing at a glance. You can identify when gravity begins to fall, how quickly fermentation develops, and when the readings start to stabilize.
The temperature curve provides additional context. It can show whether the batch remained within its intended range or experienced a change that may have affected fermentation performance.
Together, these two curves transform individual measurements into a visual history of the batch.
Keep the Batch History Through Conditioning
The information collected during Primary fermentation should remain available when the beer moves into Conditioning.
Maintaining continuity between these stages gives you a more complete view of production. You can review the gravity and temperature recorded before transfer and continue documenting the batch as it matures.
Fermentation and conditioning have different purposes, but both belong to the same batch history. Keeping that information connected makes it easier to review the process later and understand how each decision may have influenced the final beer.
Start Simple and Add IoT When You Need It
Good brewing software should adapt to the reality of the producer. For many small breweries and homebrewers, that means starting with manual readings and a clear fermentation dashboard.
With Foambyte Batch Tracking, you can manually record gravity and temperature readings, visualize your fermentation curve, and maintain an organized batch history without using IoT devices.
As your brewery grows, connected sensors may become part of your process. Until then, you can still monitor fermentation, follow conditioning, and make informed production decisions using the equipment you already have.
Brewing Software Simplified.